In partnership with a leading enterprise organization, we architected and delivered a robust, end-to-end Workforce Intelligence Platform grounded in the Microsoft Fabric ecosystem and visualized through Power BI. This initiative emerged from the need to modernize and unify the client’s fragmented workforce analytics landscape and empower leadership with timely, predictive, and strategic insights.
Before our intervention, the client operated within a legacy framework characterized by disconnected HR systems, manual Excel-based reporting, and inconsistent data extraction from SAP. These outdated practices restricted organizational agility, impaired cross-year workforce comparisons, and deprived HR leaders of actionable intelligence during critical decision-making windows.
Challenges in Workforce Data Management
The client faced deeply rooted challenges that required both technological innovation and architectural redesign:
- Disjointed Data Architecture: Workforce data was distributed across multiple unconnected systems—ranging from HRMS platforms to Excel sheets and SAP databases—with inconsistent data formats and structures.
- Inconsistent Analytics Across Time: Reporting frameworks lacked temporal standardization, rendering year-over-year and multi-year workforce comparisons unreliable.
- Lack of Predictive Insight: The absence of forecasting capabilities left HR teams reacting to issues like high attrition rates and structural inefficiencies without sufficient foresight.
- Weak Security Practices: There was no role-based access, exposing sensitive employee data to unnecessary risk.
- Manual Reporting Overload: HR spent 30+ hours monthly consolidating, cleaning, and formatting reports—time that could be redirected toward strategy and planning.
The Solution: A Scalable, Intelligent Workforce Data Platform
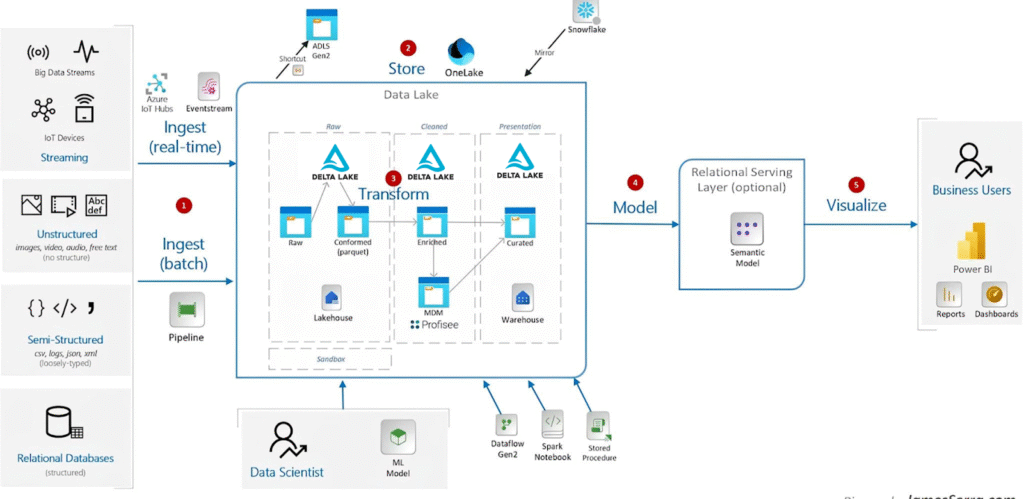
To address these problems, we built a centralized Workforce Intelligence Platform using Microsoft Fabric’s lakehouse architecture, enabling seamless data ingestion, transformation, storage, and reporting. Paired with Power BI, the platform delivers real-time dashboards and predictive analytics tailored to different personas across the organization—from HR analysts to C-level leaders.
Visit Microsoft Fabric’s official documentation to explore the technology used.
Architectural Foundation: Medallion Architecture in Microsoft Fabric
We adopted the modern medallion architecture pattern to organize data pipelines into layered, efficient stages:
- Bronze Layer:
- Ingests raw data from HRMS, SAP, and Excel sources
- Preserves original structure for auditability
- Automates ingestion for real-time updates
- Ensures long-term historical retention
- Silver Layer:
- Applies data cleansing, standardization, and deduplication
- Implements business logic, lookup resolutions, and joins
- Harmonizes datasets into unified schema models
- Aligns temporal fields across fiscal years for trend analysis
- Gold Layer:
- Houses analytics-ready datasets
- Includes pre-aggregated KPIs and calculated metrics
- Provides optimized data models for Power BI semantic layer
- Supports time intelligence for fiscal-year comparisons
Advanced Data Engineering & Transformation
Using PySpark within Microsoft Fabric notebooks, we designed complex transformation pipelines to prepare workforce data for deep analytics:
- Dynamic Tenure Banding: Employees grouped by custom tenure brackets (e.g., 0–1 year, 1–3 years, 5+ years), enabling tenure-based segmentation of insights.
- Temporal Headcount Mapping: Calculated active employee headcount across various periods, ensuring consistency across fiscal years.
- Span of Control Modeling: Evaluated organizational layers and managerial breadth to identify bottlenecks, overburdened managers, and flat structures.
- Performance Risk Fusion: Integrated performance metrics, tenure, attrition history, and demographics into a composite employee risk profile.
Data Security: Enterprise-Grade Access Controls
The platform includes enterprise-grade Row-Level Security (RLS) that restricts access to sensitive data based on:
- HR Business Region
- Functional Unit
- Managerial Hierarchy
Only authorized personnel can view detailed or aggregated information relevant to their scope, ensuring compliance and privacy.
Predictive Modeling with Machine Learning
We incorporated advanced machine learning models to proactively manage workforce risks:
- Attrition Risk Modeling: Built using Random Forest, LightGBM, and XGBoost, trained on historical data to predict future separations.
- Feature Importance Analysis: Used SHAP values to interpret model behavior and highlight key risk drivers (e.g., role changes, compensation gaps, tenure).
- Risk Scoring System: Employees were segmented into Low, Moderate, and High-Risk categories for targeted retention efforts.
Explore our AI capabilities at AI & Machine Learning
Delivered Insights & Metrics
Headcount & Movement
- Real-time active headcount with year-over-year comparisons
- YTD and monthly new hire tracking
- Attrition-adjusted headcount movement analysis
- Retention cohorts over 1, 3, and 5 years
Attrition & Exit Patterns
- YTD attrition rate, benchmarked against previous years
- Exit distribution by business unit, location, tenure group, and performance level
- Early exits (<1 year) vs. tenured exits
- High-potential attrition indicators
Risk & Retention Analytics
- Forecast of upcoming separations based on historical trends
- High-performing employees at risk of leaving
- Women and diverse groups showing early separation signals
- Department-wise retention hotspots and gaps
Organizational Hierarchy & Span Analysis
- Number of levels, span of control per manager
- IC vs. Manager ratio
- Flat vs. tall structure mapping
- Organizational “pyramid health” and balance metrics
Performance & Growth Pathways
- Promotion velocity by team, function, and gender
- Internal mobility trends
- Lateral and vertical movement analytics
Diversity & Inclusion
- Workforce composition by gender, age group, region
- Diversity in leadership vs. entry-level
- Movement and attrition of underrepresented groups
Compensation Analysis
- Compensation distribution by job level, gender, and geography
- Year-over-year salary growth trends
- Pay equity analysis
- Budget vs. actual workforce cost modeling
Power BI Dashboard Experience
- Smart Slicers for dynamic filtering (fiscal year, unit, geography)
- KPI Cards with red/yellow/green flags based on thresholds
- Drill-through for deep-dive into any metric
- Hierarchy visualizations via sunburst and decomposition trees
- Persona-specific views for Executives, HR Partners, and COEs
See how we approach visualization at Data Analytics and Visualization
Technology Stack
- Microsoft Fabric: Core lakehouse and medallion architecture
- Power BI: Embedded dashboards and semantic model layer
- Azure Active Directory: Role-based authentication and access
- Python & PySpark: Transformation, cleansing, modeling, ML pipelines
Learn more about our infrastructure at Data Engineering & Cloud Pipelines
Tangible Business Outcomes
- Reduction in manual reporting efforts, freeing HR for strategic work
- Increased high-performer retention through risk-based interventions
- Improvement in hiring efficiency using attrition forecasts
- Improved data security through role-restricted insights
- Leadership enablement with instant, persona-tailored dashboards
- Adoption of data-driven culture across HR and Finance