Client Need:
A fast-growing FMCG enterprise faced significant challenges in managing and visualizing its sales fulfillment processes effectively. With operations spread across:
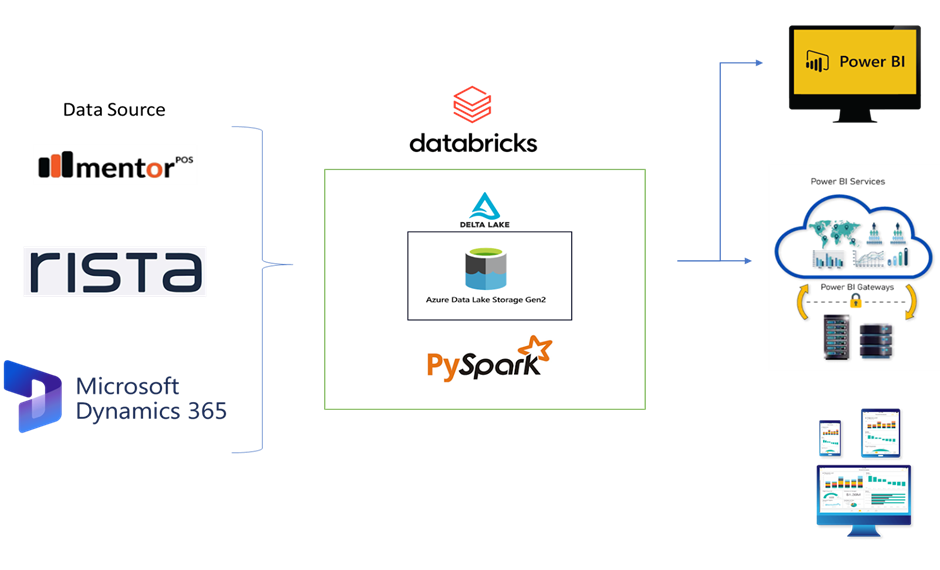
- Modern Trade (MT) via POS systems like Rista
- General Trade (GT) through third-party retail APIs like Mentor
- Warehouse Dispatch & Invoicing from Dynamics 365 F&O (ERP)
Their leadership struggled with complex data, unable to answer critical questions such as:
- How many orders were fully fulfilled, partially fulfilled, or not fulfilled at all?
- Which SKUs experience frequent delays?
- What are the most commonly out-of-stock SKUs, and where are the bottlenecks occurring within the supply chain?
The client required a unified, scalable system to automate data processing, integrate across systems, and provide real-time operational and strategic insights in the form of interactive dashboards.
Our Engineering Solution:
We designed and implemented a robust, future-proof data platform within the client’s Azure ecosystem. This platform automated data ingestion, transformed it into actionable intelligence, and powered real-time dashboards, offering end-to-end visibility into the sales fulfillment lifecycle.
Data Ingestion: Integrating APIs + ERP
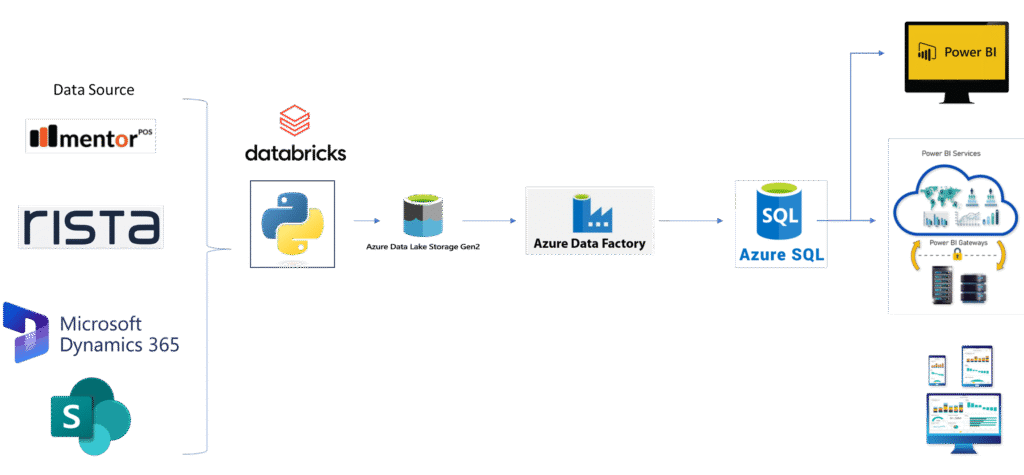
To create a unified data pipeline, we connected three data sources:
- Dynamics 365 F&O (ERP):
- We used Python-based extractions in Databricks to extract essential order, dispatch, and invoicing data. This approach overcame the limitations of the native ADF connector, ensuring complete data visibility.
- We used Python-based extractions in Databricks to extract essential order, dispatch, and invoicing data. This approach overcame the limitations of the native ADF connector, ensuring complete data visibility.
- Rista API (Modern Trade POS):
- We implemented token-based authentication and pagination to extract sales data in real-time, using Python scripts to normalize nested JSON data for consistency across records.
- Mentor API (General Trade Orders):
- Similar to Rista, we used Python-based parsing to expand and structure JSON data, ensuring that complex data was flattened and ready for downstream use.
All ingested data was stored in Azure Data Lake in partitioned Parquet format, ensuring scalability and high-performance access for future transformations.
Data Transformation (Raw to Business-Ready):
We adopted the Medallion Architecture to manage and process data in three key layers:
- Silver Layer:
- Minimal but necessary transformations, including:
- Standardizing column names, data types, and formats
- Fixing time series data inconsistencies (e.g., timestamp formats)
- Minimal but necessary transformations, including:
- Gold Layer (Business Logic):
- Business logic for final reporting was implemented in Azure SQL, where we:
- Combined data from multiple sources (API, ERP)
- Derived key metrics, such as fulfillment status, order delays, and invoicing cycles
- Created logic for SKU-level order fulfillment and delay classification
- Business logic for final reporting was implemented in Azure SQL, where we:
This step allowed us to normalize and align data across platforms, producing a business-ready model for reporting.
Orchestration: Databricks for APIs + ADF for SQL Sync
We used two orchestration tools to manage the data flow:
- Databricks (Python): Automated data extraction from APIs, writing directly to Azure Data Lake Gen2. This setup was optimized for dynamic API limits, pagination, and data expansion.
- Azure Data Factory (ADF): Managed the extraction from Azure Data Lake Gen2 to Azure SQL, ensuring seamless synchronization of data with business logic.
This orchestration strategy allowed for real-time data processing and ensured that all metrics were continuously up-to-date.
Reporting: Actionable Power BI Dashboards
The goal of this project was to deliver dynamic, self-service dashboards that empowered the client to make data-driven decisions. The dashboards provided real-time visibility into sales and fulfillment processes, turning complex data into actionable insights.
Key Features of the Dashboards:
- Sales Fulfillment Dashboard:
- Fulfillment Status Breakdown: View how many orders were fully fulfilled, partially fulfilled, or unfulfilled, with filtering options by region, warehouse, SKU, or customer type.
- Dispatch Delay Time Buckets: Automatically segmented delay data into categories: 0-24 hours, 25-48 hours, 49-72 hours, and over 72 hours, providing clear insights into bottlenecks.
- SKU-Level Analysis:
- Identify delayed SKUs and warehouse-specific issues.
- Real-time metrics on understocked SKUs, enabling quick decision-making.
- Channel Intelligence Dashboard (GT vs MT):
- Sales Trend Analysis: Compare sales performance across General Trade and Modern Trade channels in real-time.
- Fulfillment Breakdown by Channel: Track order fulfillment, transit status, and short-supply products by channel.
- SKU Performance by Channel: Identify top-performing SKUs and track SKU-specific delays to optimize inventory and sales strategies.
- Root-Cause Analysis Tools:
- Time-sensitive Analysis: Breakdown of delays by day-part, week, or season to analyze patterns.
- Detailed Exception Reporting: A drill-down tool for investigating delay causes, such as supply chain disruptions or stock-outs.
- Automated Alerts & Notifications: Dashboards include automated reports sent to key stakeholders, highlighting critical issues like delays or low stock.
- Real-Time vs. Historical Comparison:
- Multi-year Trends: Compare performance across different timeframes to identify long-term trends.
- Time-Bucketed Delays: Enable businesses to quickly assess order performance across different periods (e.g., daily, weekly, or monthly).
⚙️ Tech Stack
| Layer | Tools/Tech |
| Ingestion | Databricks (Python), REST APIs (Rista, Mentor) |
| Storage | Azure Data Lake Gen2 (Parquet Format) |
| Transformation | Azure SQL (Business Logic) |
| Orchestration | Databricks (API → ADLS), Azure Data Factory (ADLS → SQL) |
| Reporting | Power BI |
Why This Approach Works
By architecting the solution with scalability and business needs in mind, we ensured that the client could seamlessly grow their operations and data needs in the future. Here’s why it works:
- Separation of concerns between raw data, cleansed data, and business-ready data
- Real-time operational visibility without sacrificing historical analysis
- Lean processing using Databricks for basic transformations(minimal serverless costing for orchestration) and Azure SQL for heavy logic
- Full traceability from data source to dashboard, making audits and debugging easy
- Built to support future integrations and scalability (e.g., ML-driven forecasting)
Future Scope: Scalable Data Engineering with Databricks
While our current solution uses Azure SQL and Azure Data Factory (ADF), which fit well with the client’s existing tools, we see great potential in transitioning to Databricks for future growth. Databricks provides a one-stop solution for all data needs, making it ideal for companies looking for more efficient, scalable, and real-time data processing.
Key Benefits of Databricks:
- All-in-One Solution
Databricks combines data processing, transformation, and reporting in one place. This makes it easier to manage data and reduces the need for multiple tools. - Real-Time Data Processing
With Delta Lake, Databricks can handle real-time data, ensuring you always have up-to-date information for quick decision-making. - Smart Data Transformation
Databricks makes it simple to work with complex data, like nested JSON, and apply machine learning for tasks such as predicting sales or identifying trends. - Scalable and Easy to Manage
As your business grows, Databricks can scale with it. All tasks are handled within a single platform, making management simpler and more efficient. - Improved Reporting and Dashboards
Databricks integrates easily with tools like Power BI, allowing you to create real-time dashboards and reports that help you make data-driven decisions faster.
For more information on the technologies we utilized, explore our other case studies covering Data Analytics and Visualization, AI & Machine Learning, and Cloud Data Pipelines.
For further technical details on implementing similar solutions, refer to our related blog posts:
- Corporate Bankruptcy Intelligence Dashboard Using Data Scraping, GenAI-based Text Extraction, and Power BI
- Workforce Insights and HR Analytics Dashboard Using Microsoft Fabric, Power BI, and Machine Learning
- Large-Scale Incremental Ingestion from Microsoft Dynamics 365 Without Identifiers
- Dynamic Compliance Checker: Regulatory QA
- Sales Fulfillment Dashboard System with Advanced Data Engineering for Real-Time Insights