Client Challenge
A financial research firm specializing in distressed assets faced a significant challenge in identifying potentially bankrupt companies early enough to provide strategic advice to their investor clients. Analysts were manually checking multiple websites, government filings, and news sources—an inefficient, time-consuming process that often led to missed opportunities. “We need a system that can automatically gather this data from multiple sources, process it quickly, and present clear visualizations of bankruptcy risk indicators,” said the firm’s director. “The earlier we spot these companies, the more valuable our service becomes to clients.”
The Solution: Scalable Data Warehouse Architecture
After consulting with the firm, our team at Girdlab designed and implemented a comprehensive data warehouse solution using modern cloud technologies to automate bankruptcy risk detection.
Data Collection Layer
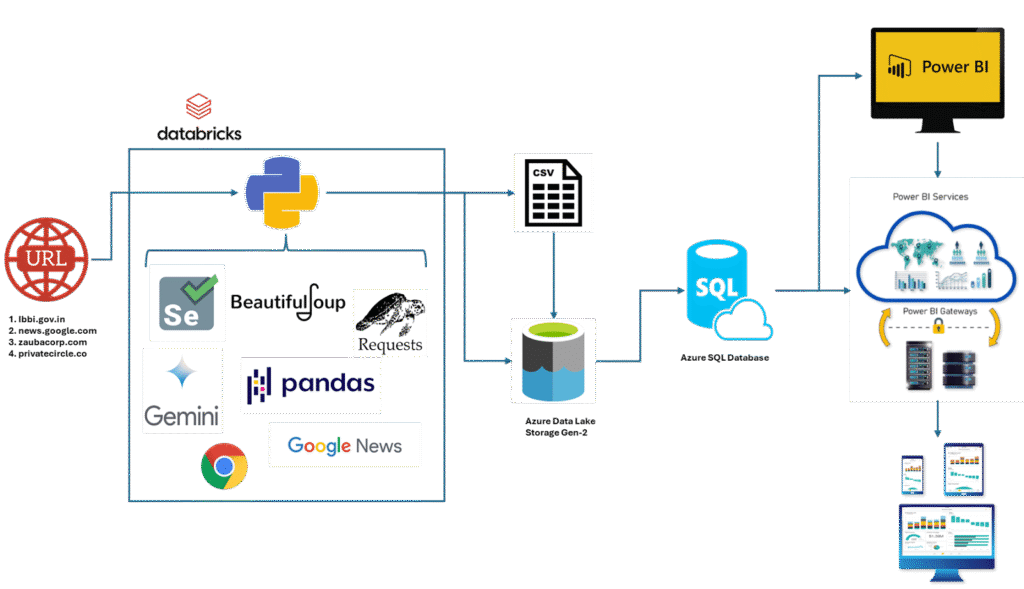
The system begins with automated data collection from four critical sources:
- Government Insolvency Registry (lbbi.gov.in): The official portal for the earliest formal bankruptcy filings and insolvency proceedings.
- News Aggregation (news.google.com): Scans thousands of articles daily for early signs of financial distress, such as layoffs, factory closures, missed payments, or management changes.
- Corporate Registration Database (zaubacorp.com): Provides company registration details, director information, and legal filings that could indicate financial distress.
- Private Company Intelligence (privatecircle.co): Offers insights into private companies not subject to public reporting requirements.
Processing Environment: Databricks
At the core of the solution is a Databricks environment that hosts a range of data processing tools:
- Selenium: Automates interactions with dynamic websites, especially those requiring login or complex navigation.
- BeautifulSoup: Extracts structured data from static HTML web pages.
- Requests: Retrieves web content and interacts with APIs programmatically.
- Pandas: Transforms raw data into structured formats suitable for analysis.
- Chrome WebDriver: Enables interaction with JavaScript-heavy websites.
- Gemini: Extracts both textual and non-textual data from PDFs, converting it into structured tables.
“The Databricks environment gives us the flexibility to run complex Python code while maintaining version control and scheduling capabilities,” explained the lead developer. “We process gigabytes of unstructured data daily, transforming it into actionable insights.”
Storage Architecture
The system uses a multi-tier storage approach:
- CSV Export Pipeline: Exports structured data into standardized CSV formats, providing a checkpoint in the processing pipeline.
- Azure Data Lake Storage Gen-2: The primary data lake that stores both raw and processed data, utilizing a hierarchical namespace for efficient organization.
- Azure SQL Database: Processes and refines data for fast analytical queries. This database serves as the primary source for the visualization layer, with tables organized by company profiles, risk indicators, and trends.
“Having both a data lake and SQL database allows us to store everything in the lake and load only the most relevant data into the SQL database for fast queries and reporting,” noted the solution architect.
Visualization and Delivery: Power BI
The final layer of the solution uses Microsoft Power BI to transform data into actionable intelligence:
- Interactive Dashboards: Custom dashboards display bankruptcy risk scores, trend indicators, and company profiles.
- Power BI Services: Cloud-based reporting ensures secure sharing of insights across the organization and with clients.
- Mobile Access: Analysts and executives can access key insights on their mobile devices while away from the office.
- Power BI Gateways: Secure connections between cloud services and on-premises systems maintain data security and compliance.
The Power BI implementation includes:
- Heat maps showing bankruptcy concentration by industry and region.
- Timeline views tracking the progression of financial distress indicators.
- Comparative analysis tools for benchmarking at-risk companies.
- Custom alert dashboards highlighting newly identified high-risk entities.
Results and Benefits
This automated bankruptcy risk detection system provided the firm with:
- A streamlined and automated process for detecting at-risk companies.
- Full visibility of all key bankruptcy indicators, reducing the reliance on manual checks.
- Improved speed and accuracy of identifying distressed assets, giving the firm a competitive edge.
- Scalable architecture to handle increasing data volumes and additional data sources.
Next Steps
To explore more about the technologies used in this solution, visit our other case studies and insights on Data Analytics and Visualization, AI & Machine Learning, and Cloud Data Pipelines.
For further technical details on implementing similar solutions, refer to our related blog posts:
- Corporate Bankruptcy Intelligence Dashboard Using Data Scraping, GenAI-based Text Extraction, and Power BI
- Workforce Insights and HR Analytics Dashboard Using Microsoft Fabric, Power BI, and Machine Learning
- Large-Scale Incremental Ingestion from Microsoft Dynamics 365 Without Identifiers
- Dynamic Compliance Checker: Regulatory QA
- Sales Fulfillment Dashboard System with Advanced Data Engineering for Real-Time Insights
You can also explore more about us on our LinkedIn, Instagram, and X.