Introduction
Dashboards used to be the crown jewel of data teams.
A place where stakeholders finally saw the numbers in real time.
But here’s the hard truth in 2025: dashboards alone no longer drive action.
The modern business doesn’t need more charts — it needs data products.
Reusable, governed, and business-ready data assets that behave more like software than static visuals.
If you’re only thinking in terms of “dashboards,” you’re playing catch-up.
Let’s talk about why data-as-a-product (DaaP) is the next frontier.
So, What Exactly Is a Data Product?
A data product is not a tool — it’s a mindset.
It’s a packaged data asset that’s:
✅ Reusable
✅ Discoverable
✅ Governed
✅ Reliable
✅ Built for a specific business outcome
Think:
- A curated customer churn model
- A real-time revenue forecasting dataset
- A sales territory optimization engine
- A supply chain anomaly alert API
Each of these isn’t a dashboard — it’s an operational product that serves a need across teams.
Dashboards Aren’t Dead — But They’re Not Enough
Let’s be clear: dashboards still have a place. But here’s where they fall short:
| Problem | Impact |
| Static filters | Business users can’t dig deep |
| Outdated data | Lack of trust in decision-making |
| Siloed views | Teams working in isolation |
| One-off builds | No reusability or standardization |
A dashboard shows you the problem. A data product solves it.
Key Ingredients of a Great Data Product
| Element | Why It Matters |
| Defined Owner | Someone accountable for its quality and updates |
| Clear SLA | Stakeholders know how fresh, reliable, and available it is |
| Metadata & Docs | Self-service discovery is easy |
| Governance | Access control, lineage, versioning |
| Feedback Loops | Stakeholders can request improvements like a product roadmap |
It’s time to manage your datasets like APIs or software modules, not static exports.
How Companies Are Building Data Products Today
Example 1: Manufacturing
A defect detection model integrated into an alerting system — not just a dashboard showing defect counts.
Example 2: Retail
A customer lifetime value (CLV) data product feeding personalized marketing engines.
Example 3: BFSI
A fraud detection pipeline that triggers risk scoring and flags anomalies for the compliance team — in real time.
In each case, the “product” isn’t the report. It’s the insight + delivery + automation loop.
How to Shift from Dashboards to Data Products
- Audit Your Dashboards
Which ones are truly used? Which can become automated insights or self-serve tools? - Design with Reuse in Mind
Build modular datasets with the expectation they’ll power many outcomes. - Create Product Owners
Assign owners to key data domains (e.g. sales, finance, HR) with ownership KPIs. - Adopt a Product Mindset
Version control, release notes, feedback tickets, usage analytics — apply them to your data assets. - Leverage Modern Tools
- Microsoft Fabric for unified lakehouse and governance
- Power BI for composable front-ends
- dbt, Azure Data Factory, Databricks for transformation pipelines
- Catalogs like Purview for discoverability and governance
- Microsoft Fabric for unified lakehouse and governance
Final Thought: Don’t Just Visualize Data — Operationalize It
In 2025, companies that win with data are treating their pipelines like products, not projects.
That means shipping, maintaining, and evolving data assets just like a SaaS team would manage code.
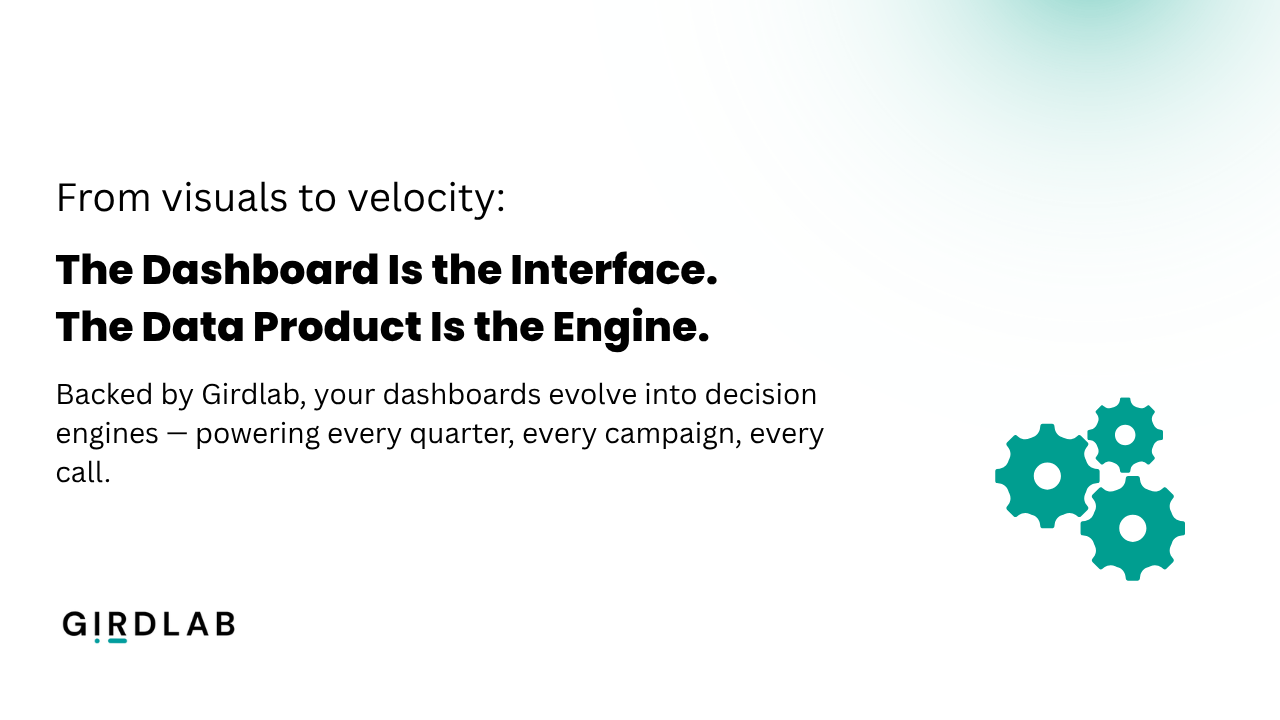
Dashboards are the tip of the iceberg.
Data products are the engine below the surface.
Ready to turn your data into strategic business assets?
Let’s Build Data Products That Drive Outcomes
At Girdlab, we help data-mature companies transition from ad-hoc reports to high-impact data products — powered by Microsoft Fabric, Power BI, and scalable cloud pipelines.
Contact@girdlab.com